If you’re a developer or a beginner in the programming world, Visual Studio Code (VS Code) is one of the most popular code editors out there that you can use. VS Code is free, open-source, and available for Windows, macOS, and Linux. It comes with many useful features, including debugging tools, Git integration, and extensions, making it an excellent tool for programming. In this guide, we’ll walk you through the basics of using Visual Studio Code, including its interface, features, keyboard shortcuts, and extensions.
Getting Started with Visual Studio Code
So.. you’ve just installed VSC, but what now? Here’s a quick overview of the different parts of the interface:
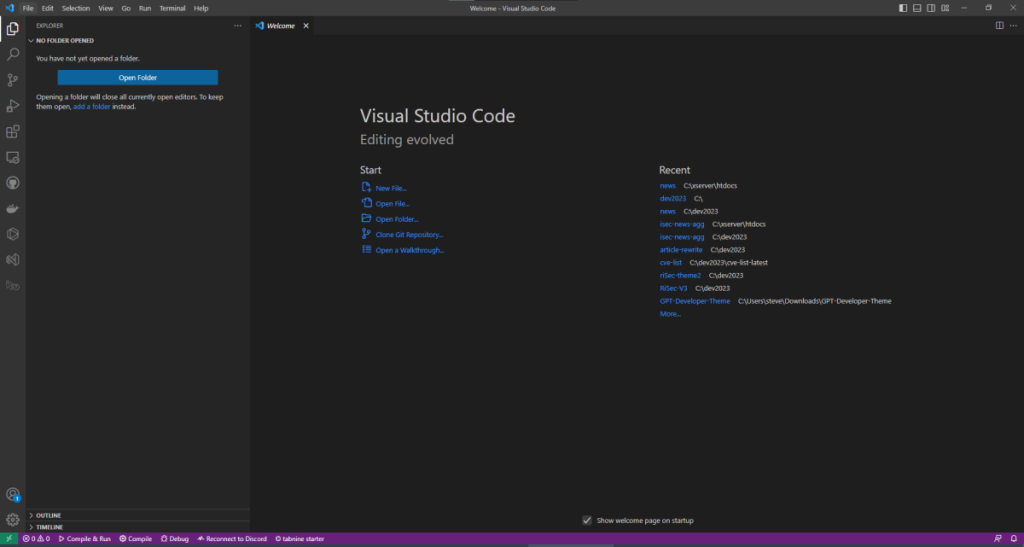
- Activity Bar – Located on the left side of the editor. It shows icons representing different activities like file navigation, debugging, extensions, etc.
- Side Bar – Located on the right side of the editor. It displays the content of the open folder or workspace.
- Editor – The main area where you write and edit your code.
- Status Bar – Located at the bottom of the editor. It displays information about the current file, line, and column number.
- Panel – Located at the bottom of the editor. It displays various types of output, such as the terminal, problems, and search results.
Basic Features of Visual Studio Code
Now that you’re familiar with the VS Code interface, let’s dive into some of the basic features you should know.
Opening and Creating Files
To open a file in VS Code, you can use the “Open File” option in the File menu, or you can use the shortcut “Ctrl+O” (Windows/Linux) or “Cmd+O” (macOS). Once you have opened a file, you can start editing it in the editor.
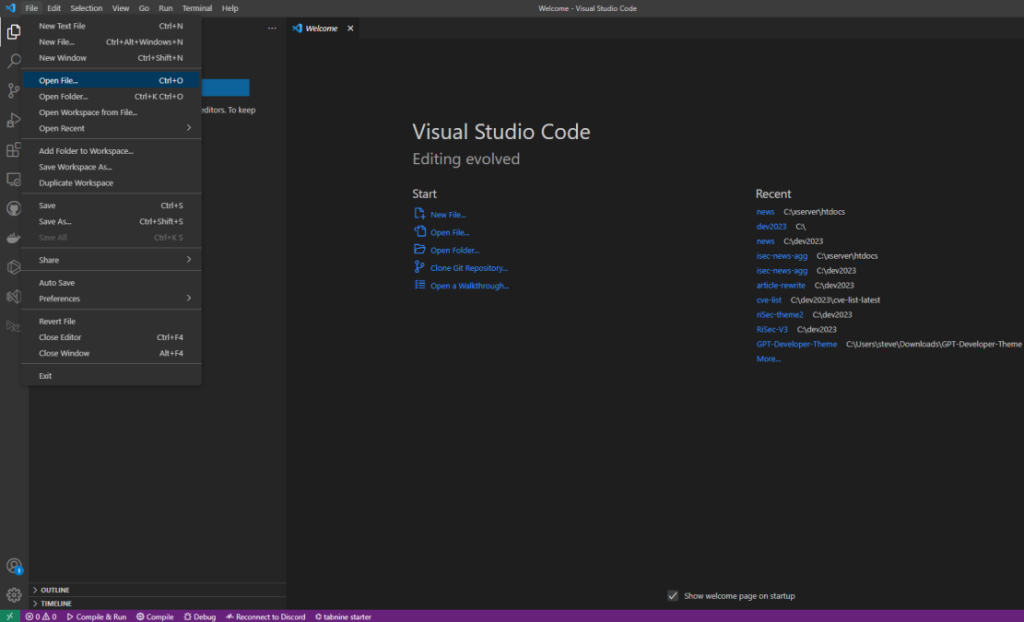
To create a new file, you can use the “New File” option in the File menu, or you can use the shortcut “Ctrl+N” (Windows/Linux) or “Cmd+N” (macOS). This will create a new untitled file, and you can save it using the “Save” option in the File menu or the shortcut “Ctrl+S” (Windows/Linux) or “Cmd+S” (macOS).
Navigating Between Files
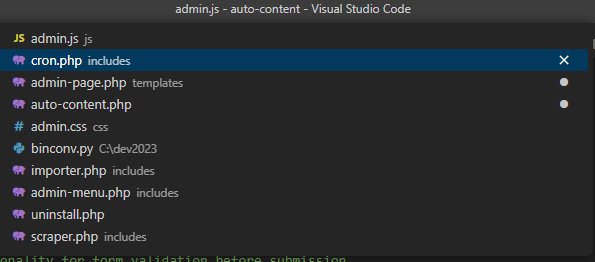
In VS Code, you can navigate between open files by using the “Switch Editor” option in the View menu, or you can use the shortcut “Ctrl+Tab” (Windows/Linux) or “Cmd+Tab” (macOS). This will bring up a list of open files, and you can select the one you want to switch to.
Keyboard Shortcuts
Keyboard shortcuts can make your work in VS Code faster and more efficient. Here are some useful keyboard shortcuts to get you started:
- Ctrl+Shift+P (Windows/Linux) or Cmd+Shift+P (macOS): Opens the Command Palette.
- Ctrl+Shift+N (Windows/Linux) or Cmd+Shift+N (macOS): Opens a new window.
- Ctrl+Shift+T (Windows/Linux) or Cmd+Shift+T (macOS): Reopens the last closed editor tab.
- Ctrl+Shift+E (Windows/Linux) or Cmd+Shift+E (macOS): Opens the File Explorer.
- Ctrl+
(Windows/Linux) or Cmd+(macOS): Opens the integrated terminal.
You can customize these keyboard shortcuts and add new ones by accessing the Keyboard Shortcuts settings. To access this, go to the File menu and click on Preferences, followed by Keyboard Shortcuts.
Keyboard Shortcuts (Continued)
- Ctrl+Shift+G (Windows/Linux) or Cmd+Shift+G (macOS): Opens the Git pane.
- Ctrl+Shift+D (Windows/Linux) or Cmd+Shift+D (macOS): Opens the Debug pane.
- Ctrl+Shift+F (Windows/Linux) or Cmd+Shift+F (macOS): Opens the Search pane.
- Ctrl+K Ctrl+S (Windows/Linux) or Cmd+K Cmd+S (macOS): Opens the Keyboard Shortcuts settings.
- Ctrl+P (Windows/Linux) or Cmd+P (macOS): Opens the Quick Open dialog box.
Integrated Terminal
The integrated terminal in VS Code allows you to execute commands directly from the editor. To open the terminal, use the shortcut “Ctrl+” (Windows/Linux) or “Cmd+” (macOS).

Once you’ve opened the terminal, you can execute any command, just as you would in a regular terminal. You can also customize the terminal by changing its font, color scheme, and other settings.
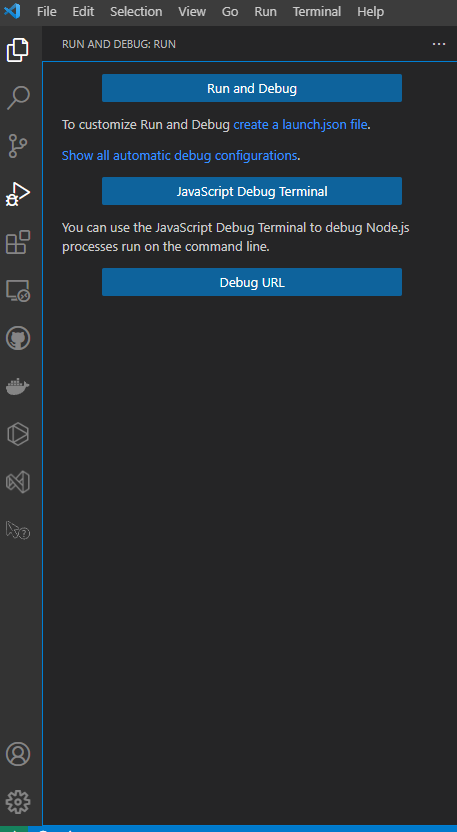
Debugging The debugging tools in VS Code are incredibly useful for finding and fixing errors in your code. To use the debugger, you’ll need to set up a launch configuration that specifies the program or script you want to debug.
To create a launch configuration, open the Debug pane by using the shortcut “Ctrl+Shift+D” (Windows/Linux) or “Cmd+Shift+D” (macOS), and click on the “Create a launch.json file” button. This will create a launch.json file in your project directory, which you can edit to specify your debugging settings.
Extensions
Extensions are add-ons that enhance the functionality of VS Code. There are thousands of extensions available, covering everything from programming languages and frameworks to themes and snippets. Some popular extensions include:
- Python: Provides support for the Python programming language.
- ESLint: Lints JavaScript and TypeScript code.
- Live Server: Launches a live server with live reload feature for static and dynamic pages.
- Bracket Pair Colorizer: Colors matching brackets in your code for easy readability.
- GitLens: Adds Git blame annotations and code lens information to your code.
To install an extension, go to the Extensions panel in the Activity Bar, search for the extension you want, and click on the “Install” button.
VSC Continued
Version Control with Git and GitHub Learning how to use version control with Git and GitHub is crucial for modern-day software development. VS Code offers built-in support for Git, making it easy to create, commit, and push changes to your Git repository directly from the editor. This section can cover basic Git and GitHub concepts, such as creating and cloning repositories, staging changes, and pushing/pulling changes to/from a remote repository.
Debugging with VS Code Debugging is an essential part of the development process, as it helps developers identify and fix errors in their code. VS Code provides powerful debugging tools that allow developers to set breakpoints, inspect variables, and step through their code to identify and fix issues. This section can cover how to set up and use the debugger in VS Code, as well as tips for effective debugging.
Customizing Visual Studio Code One of the best things about VS Code is its flexibility and customization options. Developers can customize everything from the editor theme and font to the behavior of keyboard shortcuts and extensions. This section can cover how to customize VS Code to suit your needs, including changing settings, installing and managing extensions, and creating custom keyboard shortcuts.
Practice Exercises
Exercise 1
To reinforce your learning, here are some practice exercises you can try:
- Create a new file in VS Code and write a program that prints the numbers from 1 to 10.
- Use the Git integration in VS Code to commit changes to a file in a Git repository.
- Install the Python extension and write a program that prompts the user for their name and prints a personalized message.
Exercise 2
Use the Live Server extension to launch a live server and display a simple web page. Create an HTML file with some basic content (e.g., a heading, paragraph, and image), save it, and then open it in VS Code. Install the Live Server extension from the Extensions panel, then right-click on the HTML file in the editor and select “Open with Live Server” from the context menu. This should launch a live server and open the HTML file in your default browser. Make changes to the HTML file and save them to see the changes reflected in real-time in the browser.
Exercise 3
Write a simple Python script that will generates a list of 10 random integers between 1 and 100, and then finds and prints the maximum value in the list. However, there is a bug in the program that is causing it to sometimes return the wrong maximum value. Your task is to use the debugging tools in VS Code to find and fix the bug.
Here’s some starter code to get you started:
import random

numbers = []

for i in range(10):
    numbers.append(random.randint(1, 100))

max_value = numbers[0]

for i in range(1, len(numbers)):
    if numbers[i] > max_value:
        max_value = numbers[i]

print("The maximum value is:", max_value)
To debug this script in VS Code, you can follow these steps:
- Set a breakpoint on the
printstatement by clicking on the left-hand side of the editor window next to the line number. - Start debugging by clicking on the “Run and Debug” icon in the Activity Bar, or by using the
F5keyboard shortcut. - The debugger will start and pause on the first line of the program. Use the “Step Over” (
F10) or “Step Into” (F11) commands to step through the program one line at a time, watching the values of variables and expressions in the Debug Console. - When you reach the breakpoint, inspect the value of the
max_valuevariable to see if it matches the expected value. If it does not, use the debugging tools to investigate why the value is incorrect. - Once you have identified the bug, use the editor to fix the problem, and then continue debugging to make sure the program now returns the correct maximum value.
By completing this exercise, you will have gained valuable experience in using the debugging tools in VS Code to find and fix bugs in your code!
Final thoughts;
Visual Studio Code is an incredibly powerful and versatile code editor that you can use for any programming task. With its easy-to-use interface, useful features, and vast library of extensions, it’s no wonder that it’s one of the most popular code editors out there. Hopefully, this guide has given you a good starting point for using Visual Studio Code. Happy coding!
Suggest an edit to this article
Check out our new Discord Cyber Awareness Server. Stay informed with CVE Alerts, Cybersecurity News & More!
Remember, CyberSecurity Starts With You!
- Globally, 30,000 websites are hacked daily.
- 64% of companies worldwide have experienced at least one form of a cyber attack.
- There were 20M breached records in March 2021.
- In 2020, ransomware cases grew by 150%.
- Email is responsible for around 94% of all malware.
- Every 39 seconds, there is a new attack somewhere on the web.
- An average of around 24,000 malicious mobile apps are blocked daily on the internet.

